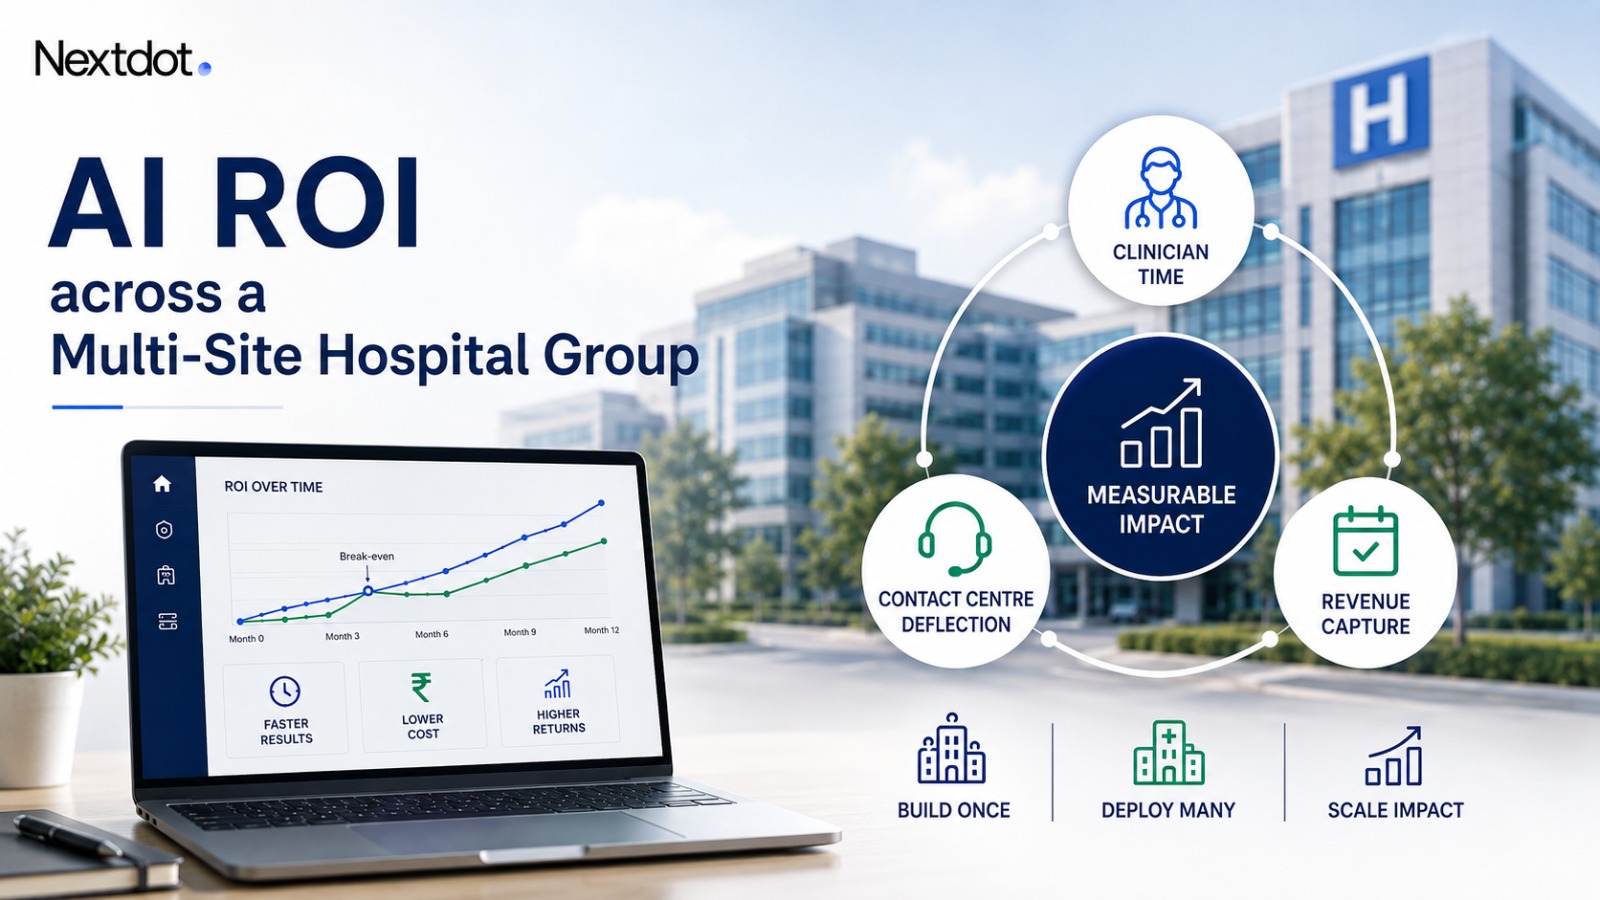
The business case that gets signed is rarely the one with the largest savings number on the cover slide. It is the one where the CIO can defend every line to the CFO nine months later, when the pilot site is live and someone asks why the number on the slide has not shown up in the P&L yet. If you are building a case for AI across a hospital group, the job is not to maximise the headline. The job is to be right about where the money lands, how long it takes to arrive, and which of your assumptions is quietly load-bearing.
This is a model you build with your own numbers. Treat the figures below as reference points from published studies and from how deployments are actually priced, then substitute your own volumes, your own tariffs, and your own site count. A business case built on someone else's benchmark is a business case that falls apart in the second budget review.
Where the savings actually land
Across a hospital group, AI savings come from three pools, and they behave very differently.
The first is clinician time on documentation. This is the pool everyone models first and overstates most. The best current evidence is a large study across five US academic centres covering 8,581 ambulatory clinicians, which found ambient AI scribes reduced total EHR time by 13.4 minutes and documentation time by 16.0 minutes per day, and was associated with 0.49 additional visits per clinician per week (reported by STAT and Healthcare Dive, April 2026). That last number is the one that matters for a business case, because minutes saved are soft until they convert into either capacity or retention. Half a visit per clinician per week, multiplied across a large outpatient roster, is real throughput. But it only materialises if your clinics are demand-constrained rather than slot-constrained. In a hospital already turning patients away, that half-visit is revenue. In a clinic with empty afternoon slots, it is just a shorter day for the doctor, which is worth something for attrition and nothing for the P&L this quarter.
The second pool is contact centre and front-office deflection. This is where the cleanest, fastest savings sit, and it is the one CFOs believe most easily because the unit economics are legible. A fully loaded human agent in an Indian metro contact centre runs roughly 8 to 20 rupees per minute once you account for salary, infrastructure, supervision, and idle time, against roughly 3 to 8 rupees per minute for a voice agent handling the same enquiry [verify: figures from Indian voice-AI vendor pricing surveys, 2026, not an independent audit]. The savings here are not really about per-minute cost. They come from deflecting the high-volume, low-complexity traffic: appointment booking, report status, directions, timing, prep instructions. If a voice agent absorbs the repetitive third of your inbound volume, the saving is the headcount you do not add as the group grows, not the headcount you remove today.
The third pool is revenue capture, and it is usually the largest and the least modelled. No-show rates in Indian OPDs run as high as 30 percent in some urban settings [verify: DocTrue and Engageo India clinic reports, 2026, vendor-published]. A voice agent that confirms, reminds, and reschedules recovers a slice of that lost capacity directly into revenue. This pool matters because it does not depend on removing any cost at all. It monetises capacity you have already paid for. When a business case underperforms, it is usually because the team modelled only the first two pools, which are cost-side and modest, and ignored the third, which is revenue-side and large.
How long the savings take to arrive
Every honest AI business case has a J-curve, and hiding it is how you lose the CFO's trust in month four. Costs land first. Integration work, clinician onboarding, and the parallel-running period where staff do the old process and the new one at once, all hit before any saving does.
Timing splits by pool. Contact centre deflection is the fast one, showing up within weeks of go-live at a site, because call deflection is measurable from day one and does not wait on behaviour change. Documentation savings are slow, and the reason is adoption, which the next section covers. Revenue capture from no-show recovery lands in the middle, dependent on how quickly your reminder and reschedule flows reach steady state.
For a multi-site group, the discipline is to model payback per site and per pool, never as one blended number. A blended payback hides the fact that your first site carries the entire build cost while later sites carry almost none. Which is the whole economic argument for doing this across sites at all.
The multi-site economics that change the case
Single-site AI is a hard business case. The build cost, the integration effort, and the model and evaluation work all land on one site's savings, and the payback often looks marginal. Multi-site is where the maths turns, because you build the intelligence once and deploy it many times.
But the reuse is uneven, and modelling it as a flat per-site cost is the most common error I see. Three things do not get cheaper at the second site: local integration into that site's HIS or EHR configuration, clinician onboarding, and site-specific evaluation. Three things collapse almost to zero: the core agent logic, the prompt and orchestration layer, and the compliance and audit scaffolding. So the second site is not half the cost of the first. It is the first site's cost minus the reusable core, which in practice means the marginal site can run 40 to 60 percent cheaper than the pilot [verify: illustrative range based on Nextdot deployment cost structure, confirm against actuals with Ayush]. [NEEDS AYUSH CONFIRMATION: do we have a real pilot-to-second-site cost delta from a live multi-site engagement to cite here instead of an illustrative range?]
This is also where the engagement model has to match the maths. A voice agent build priced at a setup fee plus monthly recurring makes sense per site, because integration is genuinely per-site work. A compliance layer licensed per entity per year makes sense group-wide, because the scaffolding is shared. The reason to separate them in the business case is that they have different owners and different budget lines, and blending them into one number gives the CFO nothing to approve incrementally.
The strategic move for a group is to fund the pilot as a capability build, not as a site return. The pilot's job is to produce the reusable core and prove the integration pattern. Sites two through ten are where the return lives, and they should be modelled as a rollout curve, not as ten independent cases.
What does not show in the business case but decides it
Here is the part that never makes the slide and determines whether the whole thing works.
Adoption gates every documentation saving. In that five-centre study, only 32 percent of clinicians who had the scribe used it in half or more of their visits, and the largest benefits accrued only above that threshold (STAT, April 2026). Read that carefully. The technology worked. The savings were real for the doctors who used it. But roughly two-thirds of the licences underdelivered because usage never reached the level where the return exists. A business case that assumes full adoption from day one is not optimistic. It is wrong. Model a ramp, budget for the onboarding that drives it, and put a named clinical champion at each site into the cost line, because that person is the difference between a licence used and a licence billed.
Attrition is the saving no CFO will let you put in the model, and it is often the biggest one. Clinician and nursing burnout carries a replacement cost that runs into lakhs per exit once you count recruitment, ramp, and lost continuity. Documentation burden is a measured driver of that burnout. You cannot cleanly attribute a retained clinician to an AI tool, so it stays out of the formal case, but a Medical Director knows exactly what a reduced attrition rate is worth, and it belongs in the conversation even when it cannot sit in the spreadsheet.
Standardisation across sites is the quiet compounding return. When every site runs the same agent, the same documentation structure, and the same audit trail, the group gains something no single-site deployment can: comparable data across sites, a single compliance posture under DPDP 2023, and one place to fix a problem instead of ten. This never appears as a rupee figure in the year-one case, and it is frequently the thing that pays back most over three years.
Building the model you can defend
The model that survives contact with a CFO has four properties. It separates cost-side savings from revenue-side capture, because they carry different confidence and land on different timelines. It models payback per site and per pool rather than as one blended number. It shows the J-curve honestly, with costs landing before returns. And it puts adoption on the critical path, with the onboarding investment that adoption requires written into the cost line rather than assumed away.
The uncomfortable truth is that the strongest business case is usually the more conservative one. A case that promises a modest, well-timed, defensible return and then beats it earns the CIO the credibility to fund the next phase. A case built on the biggest number on the slide gets signed once and never again. Across a multi-site group, where the real return depends on getting to site ten, the ability to fund the next phase is the entire game.