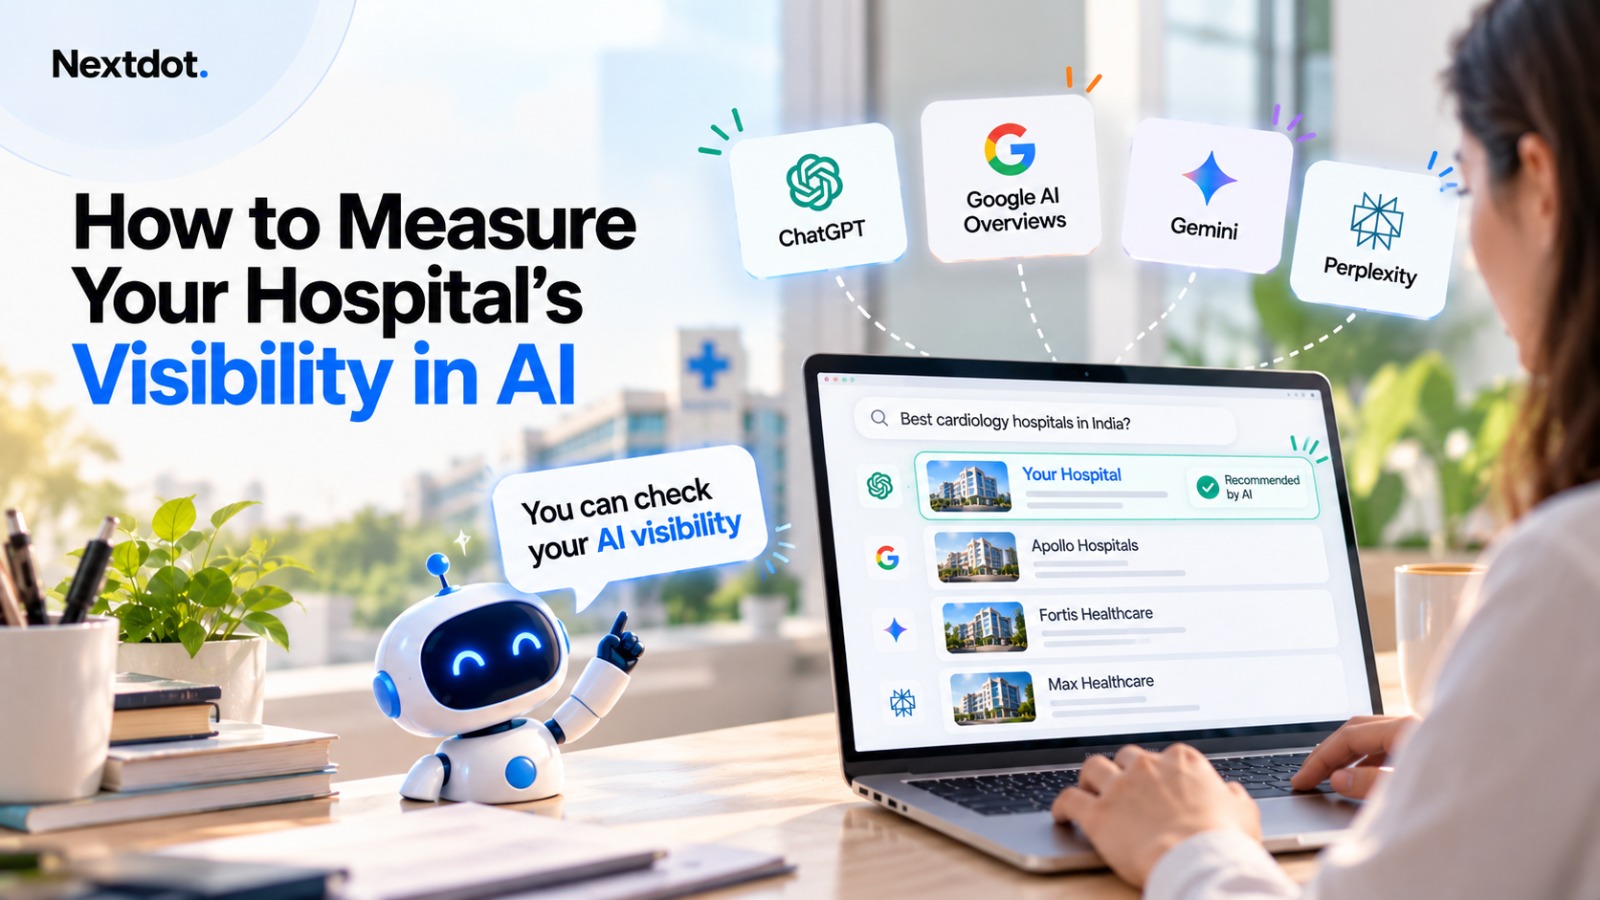
To measure a hospital's visibility in AI answers, run a fixed panel of patient questions through ChatGPT, Perplexity, Gemini and Google AI Overviews, repeat each question several times per engine, and count how often your hospital appears across all those runs. That percentage is your share of answer. Track it monthly against the same panel and the same named competitors, and you have a number a marketing team can move and a board can read.
A single check tells you almost nothing about next week. In January 2026, SparkToro and Gumshoe.ai published research in which volunteers ran identical recommendation prompts through ChatGPT, Claude and Google's AI close to 3,000 times. One of the twelve prompts tested asked for cancer care hospitals. Across tools and prompts, the chance of getting the same list of brands twice was under 1 in 100, and the chance of the same list in the same order was under 1 in 1,000 (Source: SparkToro and Gumshoe.ai, January 2026, as reported by Search Engine Journal, 30 January 2026). A screenshot of one ChatGPT answer in last quarter's deck described one draw from a distribution.
Why the ten-minute check stops being enough
"How to Check Whether Your Business Appears in AI Answers (A 10-Minute Method)" is still the right first step. It tells you whether you have a problem.
It cannot tell you whether the problem is getting better. Once a hospital starts fixing its doctor pages, its listings and its structured content, the question from the CMO's own leadership changes from "are we visible" to "did the work we paid for move anything". A one-off check answers the first question. Only a measurement programme answers the second.
A visibility programme with no baseline has no way to prove its own value.
AI answers are a distribution, so measure them like one
Answer engines generate text by sampling. Ask the same question twice and the model can pick different hospitals or cite different sources. This holds for Google as well. Ahrefs tracked more than 43,000 keywords and found that AI Overviews had a 70 percent chance of changing between consecutive observations, with content persisting 2.15 days on average, and that roughly 45.5 percent of cited sources were new each time the same query re-ran (Source: Ahrefs, Louise Linehan, 11 November 2025).
The same Ahrefs study found something useful underneath the churn. The meaning of the answers stayed highly consistent, with a semantic similarity score of 0.95 out of 1. SparkToro's data points the same way: the specific list and its order vary wildly, while how often a given brand shows up across many runs is far more stable.
That gives the measurement design its logic. Position in a single answer is noise. Frequency of appearance across many answers is signal. The useful question for a hospital becomes: in what share of relevant answers do we appear?
What share of answer actually counts
Share of answer is the number of AI answers that name your hospital, divided by the total number of answers collected for a defined panel of questions, engines and runs. If you ran 40 questions, four engines and five runs each, you collected 800 answers. If your hospital appeared in 216 of them, your share of answer is 27 percent.
Report it alongside three companion measures, because the headline number alone can mislead.
Accuracy rate. Of the answers that name you, how many state your specialities, locations, doctors and timings correctly. A hospital named in half of all answers with wrong OPD timings in a third of them has a correction problem before it has a visibility problem.
Competitor share. Run the same panel and count the same way for three to five named competitors in your city. Your 27 percent reads very differently if the leading rival sits at 60 percent or at 12.
Source share. For engines that show citations, Perplexity and AI Overviews especially, record which domains the answer drew on. When your own site rarely appears in the citations while directory and aggregator sites dominate, you know where the fixing work sits.
Split the headline by engine and by specialty. A cardiac programme can hold a strong share on Perplexity and near zero in AI Overviews, and a blended number hides that gap.
Build the prompt panel before you run anything
The panel is the instrument. Change it casually and every month's number stops being comparable to the last.
Start from how patients ask. Many hospital discovery questions combine a condition or procedure, a place, and an intent: "best hospital for knee replacement in Pune", "which cardiologist should I see for palpitations in Whitefield", "where can I get a second opinion for thyroid cancer in Kolkata". Build the panel as a grid of your priority service lines against your catchment areas, with two or three intents each: choosing a hospital, choosing a doctor, and checking cost or procedure details.
Keep every question unbranded. A prompt containing your hospital's name measures recall of a brand the patient already knows. Share of answer measures whether the engine brings you up when the patient has not heard of you yet.
Weight the panel by revenue. If orthopaedics and oncology drive most of your inpatient income, they should carry most of the questions. A panel that gives equal weight to every department produces a number that moves when low-value service lines move.
Add language variants where your patients use them. If a meaningful share of your catchment asks in Hindi or Hinglish, include those phrasings as separate prompts and report them separately. Language changes the answer. A report by FTA Global put the same Mumbai buying question to AI assistants in English, Hindi and Hinglish, and the Hindi answer swapped one brand from the English list for another (Source: FTA Global, as reported by Social Samosa, 17 September 2026).
Then lock the panel. Give it a version number, store the exact wording, and change it at most once a quarter with a note explaining what changed and why.
Runs, engines and cadence
Cover ChatGPT, Perplexity, Gemini and Google AI Overviews. They draw on different sources and move independently, so each needs its own line in the report.
Run each prompt several times per engine per measurement cycle. The arithmetic is simple. With one run, a prompt either names you or it does not, and your score for that prompt is 0 or 100. With five runs, each additional appearance moves the prompt's score by 20 points. With ten, by 10. More runs per prompt narrow the swing, and the panel as a whole narrows it further. Pick a number your team can sustain every month and hold it fixed.
Control what you can. Run from a clean session without logged-in history, fix the location where the engine allows it, and record the date, engine, model version where shown, and the full answer text. Store the raw answers alongside the tally. When the number moves, the raw text is how you find out why.
Measure monthly. AI Overviews content turns over in days, according to the Ahrefs data above, so a quarterly check can land on an unusual week and mislead you for three months. Monthly gives you twelve points a year, enough to separate a trend from a wobble. Treat a change of a few points in a single month as noise until the next cycle confirms it.
What to put in front of leadership
A useful monthly report fits on one page. Show share of answer for the full panel against the previous three months, the same figure for each named competitor, the accuracy rate, and the top five prompts where a competitor appears and you do not. Add a short list of the fixes shipped that month, such as updated doctor profiles, corrected listings or new structured content, so readers can connect the work to the movement.
Keep the causal claim modest. Engines update their models and their retrieval without notice, and a rise in share can come from an engine change as easily as from your own work. The competitor benchmark is your control: if every hospital in the panel moves up together, the engine changed. If you move and your rivals stay flat, your work probably did it.
Where the Doc Mirror audit fits
A measurement programme needs a baseline, and the baseline needs to cover both what the engines say and the state of your own public presence. The Doc Mirror audit looks at both. It queries ChatGPT, Perplexity, Gemini and Google AI Overviews to see how a doctor or hospital is described, and it audits Google, search results, YouTube and site performance through PageSpeed. It also reads and validates the schema.org markup on hospital and doctor pages.
Doc Mirror runs repeated queries and tracks share of answer over time against the competitors you name, which is the measurement programme this piece describes. The first run gives a hospital marketing team its starting line: how the engines describe your hospital and doctors today, and how often you appear against your rivals. Run it before you commit budget to fixes, then hold every later month against that baseline.
Frequently asked questions
What is share of answer?
Share of answer is the percentage of AI-generated answers, across a fixed set of questions, engines and repeated runs, that name your hospital. It replaces ranking position as the measure of AI visibility, because answer engines rarely return the same list twice and position in any single answer is mostly noise.
How do you track visibility in ChatGPT and Perplexity?
Build a locked panel of unbranded patient questions covering your priority service lines and locations, run each question several times in ChatGPT and Perplexity from a clean session, store the full answer text, and count how often your hospital and each named competitor appear. Perplexity also shows its citations, so record which domains it drew on.
Why do AI answers change every time?
Answer engines generate each response by sampling, and their retrieval pulls a shifting set of sources. Research by SparkToro and Gumshoe.ai in January 2026 found that the same brand list came back less than 1 percent of the time across repeated runs, and Ahrefs found in November 2025 that AI Overviews content changed between consecutive observations about 70 percent of the time.
How often should you measure AI visibility?
Monthly, against the same panel and competitors. AI Overviews content turns over in days, so a quarterly snapshot can catch an unusual week and mislead you for months. Monthly measurement gives enough points in a year to tell a real trend from ordinary movement between runs.