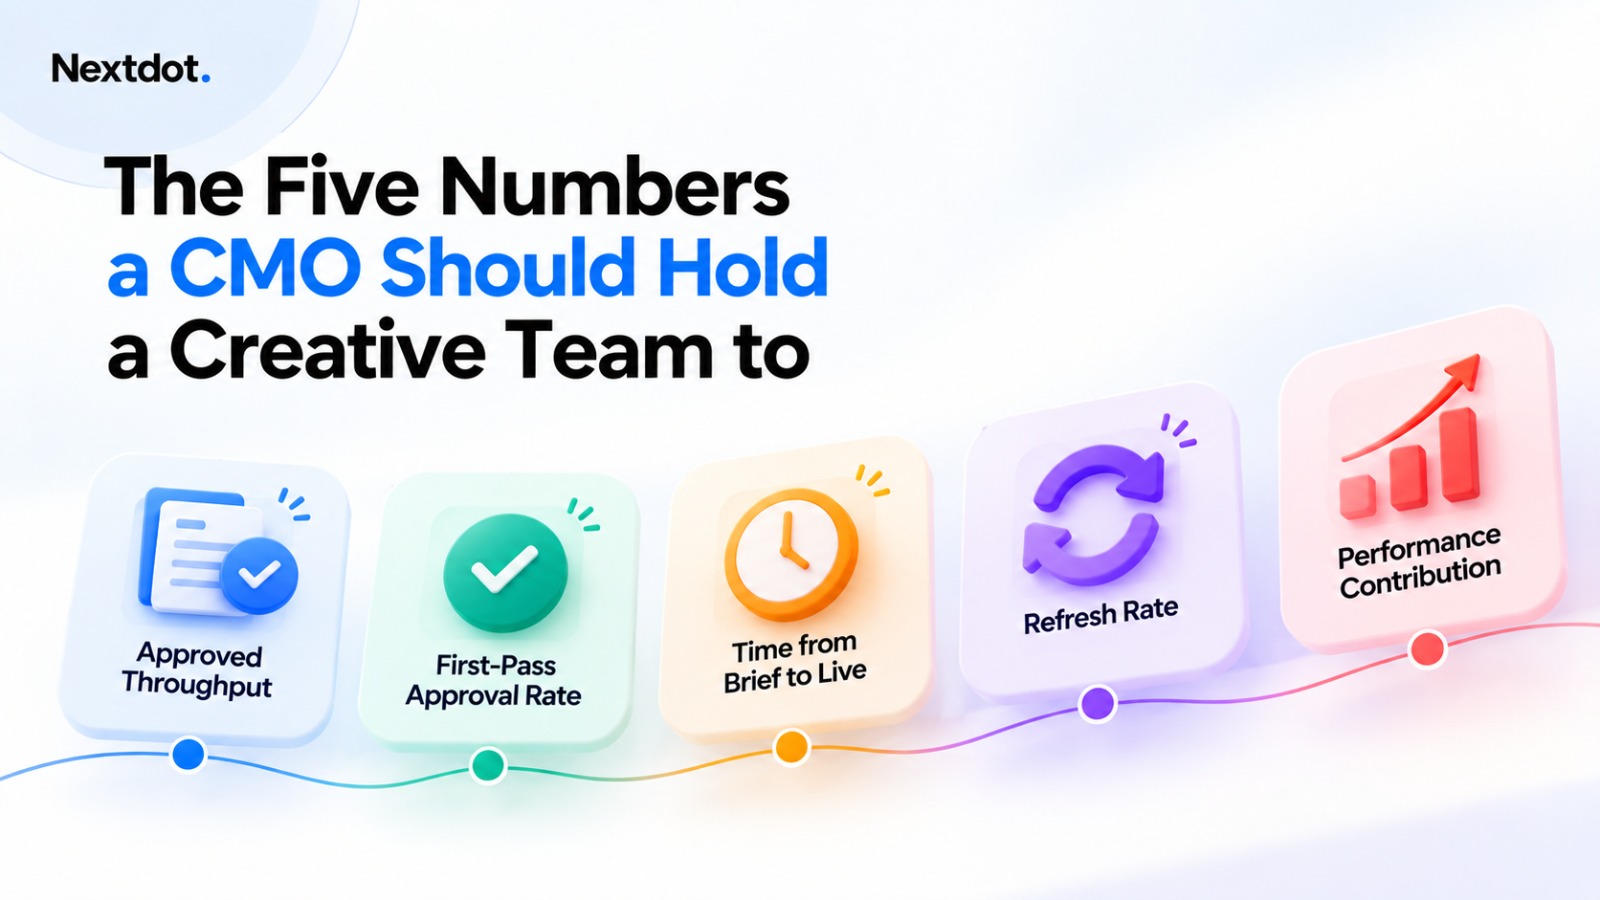
A CMO should measure a creative team on five numbers: approved throughput, first-pass approval rate, time from brief to live, refresh rate against creative fatigue, and performance contribution at the level of the individual asset. The first four measure the production system, and a team controls them directly. The fifth measures whether the work moved the business, and it needs honest limits on what attribution can prove.
Most creative scorecards count what is easy to count: assets delivered, posts published, awards entered. None of those tell you whether the team is getting better. Creative is the lever that matters most, too. Nielsen found that when creative is strong it drives up to 89 percent of the sales lift from digital advertising (Source: Nielsen, "Perspectives: Want a Successful Ad? Get Creative", October 2017). A separate Nielsen analysis of nearly 500 campaigns put creative's share of advertising-driven sales at 47 percent, ahead of reach, brand and targeting (Source: Nielsen, "When It Comes to Advertising Effectiveness, What Is Key?", 2017). If creative carries that much of the outcome, it deserves a scorecard as disciplined as the one your media team already lives by.
Treat what follows as a buyer's test. Put these five questions to any agency, in-house team or embedded pod, including Nextdot's own Creative Intelligence Pod. A team that cannot report all five each month is guessing about its own performance.
Number one: approved throughput
Throughput is the number of creatives that cleared final approval and went live in a month. Count only those. Drafts, variants that died in review and assets that sat in a folder do not count.
Specify it this way because production volume and approved volume drift apart fast once generation gets cheap. A team can produce six hundred drafts and ship forty. If the vendor reports the six hundred, you are paying for motion. The review capacity behind any volume figure decides whether the figure means anything, a point "The Production Math: Throughput Without Quality Collapse" works through in detail.
Break throughput out by format and purpose: reels, statics, carousels, and performance versus brand. As a reference point, Nextdot's pod runs a production line built for 250 fresh creatives a month for a large Indian hospital group, a mix of reels and statics across performance and branding. Read it as an internal benchmark for one account under one review model.
What to ask: how many creatives went live last month, split by format, and how many drafts it took to get there.
Number two: first-pass approval rate
First-pass approval rate is the share of creatives your team approves at the first review with no revision round. If 100 assets reach your brand reviewer and 62 go through untouched, the rate is 62 percent.
This is the clearest measure we know of whether a creative team understands your brand. A low rate means the team is guessing at tone, claims and visual rules, and your reviewers are doing the creative direction for free.
Two cautions. First, a rate near 100 percent can mean the reviewer has stopped reading closely. Pair the number with a spot audit of approved work each month. Second, the number should rise over time. A team that holds your briefs, approvals and rejections in a working memory should need fewer rounds in month six than in month one. If the rate is flat after a quarter, the team is starting each brief from scratch.
We do not publish a target rate, because the right number depends on how regulated the category is and how mature the brand system is.
What to ask: what share of last month's work cleared on first review, and how that share has moved over the last three months.
Number three: time from brief to live
Brief to live is the elapsed time from the moment a signed-off brief reaches the team to the moment the creative runs in market. Report the median and the slowest ten percent, because averages hide stalled briefs.
Split the number into two parts: time with the creative team and time waiting on your side. When you measure this for the first time, check how much of the calendar sits in client review. "Where the Approval Loop Breaks" covers how to fix the approval loop itself. For scorecard purposes, the split matters because it tells you who owns the delay. A vendor who reports a single blended figure is either not tracking the split or would prefer you did not see it.
What to ask: median and slowest-decile brief-to-live time last month, with production time and client review time reported separately.
Number four: refresh rate against creative fatigue
Creative fatigue is the point where an asset's performance decays because the same audience has seen it too often. You see it as a falling click-through or hook rate on a creative whose spend and targeting stayed the same, usually alongside rising frequency and cost per result.
Measure fatigue against each asset's own baseline. Take the asset's first full week in market as the baseline, and flag it once its click-through or cost per result moves past a threshold you set in advance, for example a sustained decline of a fixed percentage. Published industry thresholds vary widely by platform, audience size and spend, so set your own from your accounts' history and write it down. Borrowed rules of thumb are a poor substitute.
The KPI is refresh rate: the share of fatigued assets the team replaced with a fresh creative before performance fell past the threshold. A team with high throughput and a low refresh rate is making new work in the wrong places. The goal is to point volume at the ad sets that are wearing out.
What to ask: how many assets hit the fatigue threshold last month, and how many were replaced before or after they crossed it.
Number five: performance contribution, and where attribution stops being honest
Performance contribution is what the creative did for the business, read at the level of the individual asset: cost per lead, cost per acquisition, click-through and hook rate for performance work, and saves, shares and watch-through for organic. Report it asset by asset and creative variable by variable, because a campaign average hides the one asset carrying the result.
Attribution is honest in some places and misleading in others, and a good team tells you which is which.
It is honest when you compare creatives inside the same ad set, on the same audience and budget, over the same window. The difference between two variants there is mostly creative. It is more honest still when the test changes one variable at a time.
It gets unreliable when a team credits a brand film with pipeline, or claims a single creative drove a month's appointments. Platform-reported conversions overlap across channels, view-through windows inflate credit, and in healthcare the patient journey often runs through a phone call, a referral and a walk-in that no ad platform sees. A team that reports every metric as proof of its own impact is selling. A team that says "this variant beat that one by this margin, and we cannot tell you how much of the month's revenue it caused" is telling you the truth.
For brand work, ask for evidence that holds up without last-click attribution: organic shares and saves, search volume for the brand or service line, and where the budget allows, a geo or holdout test.
What to ask: the top and bottom five assets last month by cost per result, the one variable that separated them, and what changed in this month's briefs because of it.
How to run the five as a monthly scorecard
Put all five on one page, reported monthly, with three months of trend beside each. The trend matters more than any single month. The numbers also check one another. High throughput with a falling first-pass rate means the team is shipping volume your reviewers are fixing. Fast brief-to-live with a low refresh rate means speed is going to new briefs while live assets wear out. Strong performance contribution with no stated attribution method means the fifth number is a story.
Agree on the definitions in the contract before the first brief: what counts as approved, what counts as a revision round, where the brief-to-live clock starts and stops, and what fatigue threshold triggers a refresh. A metric defined after the fact gets defined in the vendor's favour.
Hold every creative team to the same page, including the one we run. A creative function that learns from outcomes should show it in these five numbers within a quarter. If it cannot, the learning is a claim.
Frequently asked questions
How do you measure a creative team's performance?
Measure five numbers each month: approved throughput, first-pass approval rate, time from brief to live, refresh rate against creative fatigue, and performance contribution by individual asset. The first four measure the production system and the fifth measures business impact. Read all five as a three-month trend, because improvement over time is the clearest sign that a team is learning from your briefs, approvals and results.
What is first-pass approval rate?
First-pass approval rate is the percentage of creatives a brand approves at their first review, with no revision round. If 100 assets go to review and 62 pass unchanged, the rate is 62 percent. It shows how well the team understands the brand's tone, claims and visual rules. It should rise over time, and a rate near 100 percent deserves a spot audit to confirm reviewers are still reading closely.
How do you measure creative fatigue?
Set a baseline for each asset from its first full week in market, then track click-through, hook rate and cost per result against that baseline while spend and targeting stay constant. When performance declines past a threshold you set in advance, the asset is fatigued. Rising frequency usually appears alongside it. The management metric is refresh rate: the share of fatigued assets replaced before they cross the threshold.
Can you attribute performance to a single creative?
Partly. Comparing creatives within the same ad set, audience, budget and time window gives a fair read of which variant performed better, especially when one variable changes at a time. Attributing total revenue or appointments to one creative is unreliable, because platform conversions overlap, view-through windows inflate credit, and many healthcare patient journeys run through calls and referrals that ad platforms cannot see.